
⚡ Ragone Plots Explained: Benchmarking Battery Performance with Power vs Energy
A practical deep dive into how Ragone plots help engineers compare battery chemistries, cooling strategies, and thermal conditions.

Battery benchmarking is often reduced to a single headline number — energy density, power output, cycle life. But in real engineering applications, performance is always a trade-off.
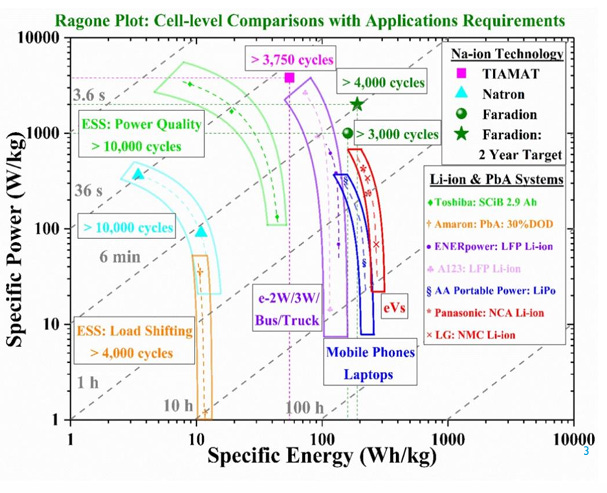
In a recent technical workshop by AEMILIO, Dr. Eric Prada presents a structured methodology for benchmarking battery systems using Ragone plots, combining model-based analytics, synthetic data, and thermal analysis to better understand real-world performance envelopes
This post summarizes the key technical insights from that workshop.
What Is a Ragone Plot?
A Ragone plot is a graphical tool used to compare battery technologies by plotting:
Specific Energy (Wh/kg) on the x-axis
Specific Power (W/kg) on the y-axis
As introduced in the workshop (see page 3), Ragone plots allow engineers to visualize the trade-off between energy capacity and power capability across different battery chemistries and cell typologies
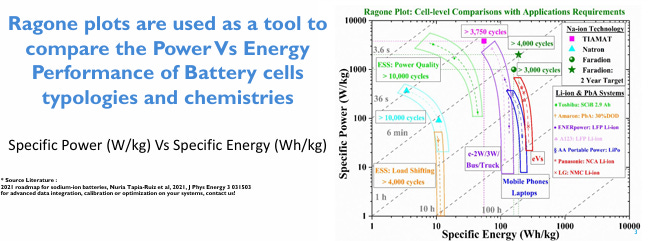
In simple terms:
High specific energy → long runtime
High specific power → fast discharge / high acceleration capability
But increasing one typically reduces the other.
This visualization becomes essential when matching batteries to applications such as:
Electric vehicles
Energy storage systems (ESS)
Portable electronics
High-power industrial systems
Case Study: 18650 Li-Ion (NMC/Graphite) Cell
The workshop then analyzes a cylindrical 18650 lithium-ion cell using NMC cathode and graphite anode (page 4)
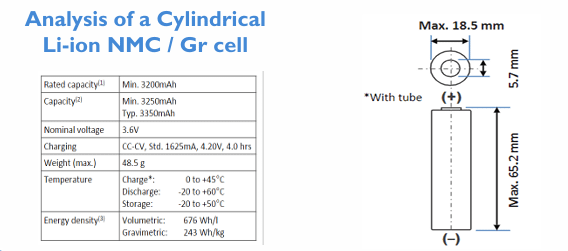
Key Specifications
From the document:
Rated capacity: ≥ 3200 mAh
Typical capacity: 3350 mAh
Nominal voltage: 3.6 V
Max weight: 48.5 g
Energy density:
676 Wh/L (volumetric)
243 Wh/kg (gravimetric)
Operating temperature ranges:
Charge: 0 to +45°C
Discharge: –20 to +60°C
Storage: –20 to +50°C
These baseline specs define the starting point for performance benchmarking
Why Cooling Changes Everything
One of the most important insights from the workshop is this:
Cooling power dramatically shifts the Ragone curve.
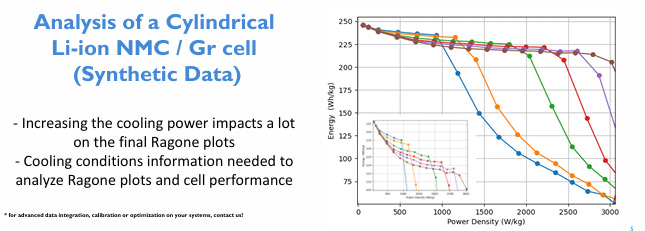
Using synthetic model-based data (pages 5–6), the workshop shows that increasing cooling capability significantly improves high-power performance
What the Graphs Show
The Ragone plots demonstrate:
At low cooling levels → energy drops sharply at high power density.
With stronger cooling → the energy plateau extends further into high-power regions.
The entire performance envelope shifts upward.
This happens because:
Higher discharge rates increase internal resistance heating.
Without adequate cooling, thermal limits are reached sooner.
Thermal constraints, not electrochemistry alone, define usable performance.
Conclusion:
You cannot interpret a Ragone plot correctly without knowing the cooling conditions.
Cooling is not a secondary parameter — it fundamentally defines achievable power density.
Impact of Temperature: The Hidden Variable
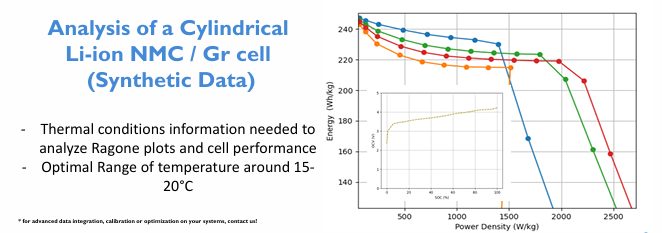
The workshop also explores the impact of ambient and operating temperature on performance (page 7)
Key Takeaway:
Thermal conditions must be specified when analyzing Ragone plots.
Optimal operating range is approximately 15–20°C.
Outside this range:
Low temperatures increase internal resistance → reduced power capability.
High temperatures accelerate degradation and limit sustained output.
Energy availability drops faster at high power densities.
This reinforces a crucial engineering principle:
Battery benchmarking is meaningless without thermal context.
Temperature, cooling strategy, and discharge profile must be analyzed together.
Beyond Static Specs: Why Model-Based Benchmarking Matters
The workshop emphasizes model-based methodologies rather than relying solely on manufacturer datasheets
Why?
Because datasheets typically provide:
Nominal energy density
Standard discharge curves
Limited test conditions
But real-world applications demand:
Dynamic load profiles
Transient thermal effects
Application-specific duty cycles
Degradation modeling
By integrating:
Analytics
Digital twins
Synthetic simulation data
Engineers can generate application-specific Ragone plots instead of generic ones.
This allows:
System-level optimization
Accurate performance forecasting
Improved cooling system sizing
Better architecture decisions
Practical Engineering Implications
Here’s what this workshop makes clear:
1. A Ragone plot is not static.
It changes based on:
Cooling power
Ambient temperature
Discharge rate
Modeling assumptions
2. Thermal management is performance management.
Improving cooling can:
Increase usable power density
Extend energy retention at high load
Shift the entire performance boundary
3. Battery selection must be application-driven.
For example:
EV acceleration → prioritize high specific power
Grid storage → prioritize energy density and cycle life
Portable electronics → maximize energy density under mild loads
4. Data science and digital twins are now core tools.
Benchmarking is no longer just lab testing — it’s simulation-driven and model-enhanced.
Final Thoughts
This workshop makes a compelling case that:
Battery performance benchmarking must move beyond single-number metrics.
Ragone plots provide a powerful visualization of trade-offs — but only when interpreted within a full thermal and system context.
The combination of:
Electrochemical modeling
Thermal analysis
Synthetic simulation data
Data science workflows
enables a far more accurate understanding of how batteries perform in real applications.
As electrification accelerates across mobility, grid storage, and industry, this kind of integrated benchmarking approach becomes essential.
If you work in:
EV engineering
Battery system design
Energy storage
Thermal management
Digital twin modeling
Understanding Ragone plots at this level isn’t optional — it’s foundational.
